Introduction
I wanted to build my own system info plugin for my Elgato Stream Deck and make it look polished. The goal was a clean visual style, live metric updates, and a setup that still stayed simple to maintain over time.
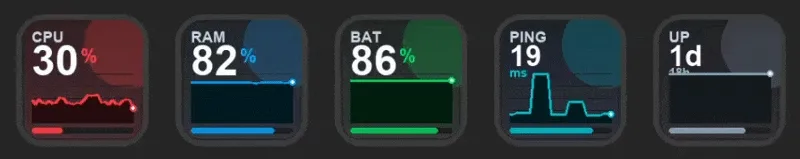
That turned into Pulse Deck: System Info: a macOS-focused Elgato Stream Deck plugin that shows live system metrics with compact graph-based key icons.
![]()
The complete code for this project is available on GitHub: pulse-deck
Demo
Project Goals
I kept the initial goals straightforward:
- Accurate metrics on macOS
- Professional-looking key tiles with live updates
- Low overhead and maintainable code
- Simple configuration in Elgato Stream Deck UI
Scope-wise, I started with core system signals and expanded based on practical usefulness:
- CPU usage
- RAM usage
- Ping latency
- Battery level
- Uptime
Why Metric Accuracy Needed Extra Work
CPU and memory are deceptively tricky if you want values that match what users expect from trusted system monitors.
CPU usage
For CPU, I used a snapshot-delta approach and aligned calculation behavior with how Stats (exelban/stats) computes usage:
totalUsage = (systemDelta + userDelta) / totalTicksThat excludes idle from the numerator and uses total tick deltas as denominator, giving stable percentages that match familiar tooling behavior more closely.
RAM usage
RAM was the bigger challenge. A simple os.totalmem() - os.freemem() approximation is usually not what users see in tools like Stats or Activity Monitor views.
To improve this, the plugin parses vm_stat and computes used memory with a Stats-aligned page formula:
used = active + inactive + speculative + wired + compressed - purgeable - externalThat was the key step for making memory values feel “right” in day-to-day use.
Plugin Architecture (Simple but Effective)
The plugin runtime is intentionally minimal:
- Node.js plugin process handles Elgato Stream Deck events and polling.
- Metric sampler collects and caches system values.
- Python renderer generates polished key images (value + graph) per metric.
- Property inspector provides a lightweight settings UI (for ping interval).
Data flow is straightforward:
- Active keys are tracked by metric type.
- A poll loop samples only active metrics.
- Metric history is updated for graph rendering.
- Renderer outputs tile images.
- Images are pushed to all contexts using that metric.
This keeps behavior predictable and avoids unnecessary work when a metric isn’t on any key.
UX Decisions That Made a Difference
A few small decisions improved usability a lot:
- Familiar color semantics (for example, battery stays green in healthy range)
- Consistent compact graph style across all metrics
- No noisy labels on keys (metric-first visual hierarchy)
- Simple ping interval setting as a plain text input in property inspector
The ping interval defaults to 30 seconds, which is a good balance for network signal without excessive probing.
Component Selection: Practical Over Theoretical
I explored several candidate components:
- LAN
- Wi-Fi
- SSD usage
- CPU temperature
- battery
- ping
- uptime
In practice, some looked good on paper but had low value on an Elgato Stream Deck key (for example, SSD percentage often felt static). I ended up favoring metrics that change often enough to be meaningful at a glance.
That process led to a better “daily driver” set: CPU, RAM, ping, battery, and uptime.
Repo and Packaging
Alongside feature work, I also cleaned up project ergonomics:
- standardized naming to match product identity
- improved README and repo metadata
- added
.gitignore - local install and packaging scripts for faster iteration
These don’t change visuals directly, but they make future updates much easier.
Closing Thoughts
This project ended up being a good reminder that “small utility plugin” does not mean trivial engineering. Getting trustworthy system numbers, clean visuals, and stable runtime behavior all at once requires careful tradeoffs.
Pulse Deck is now in a place I like: useful every day, visually clean, and simple enough to extend without creating maintenance debt.